Overview
The Service Alert feature in Ceburu allows users to configure alerts for monitoring services running on devices. Service Alerts are created and managed through the Asset Alert tab, where users can select services, configure alert conditions, and manage notifications.
Users can also view service related triggers through the Alarms/Triggers page.
1. Accessing Service Alerts
To access Service Alerts:
Log in to the Ceburu portal.
Navigate to Settings > Configurations > Alert.
Select the Asset Alert tab.
Locate alerts with Alert Type = Services.
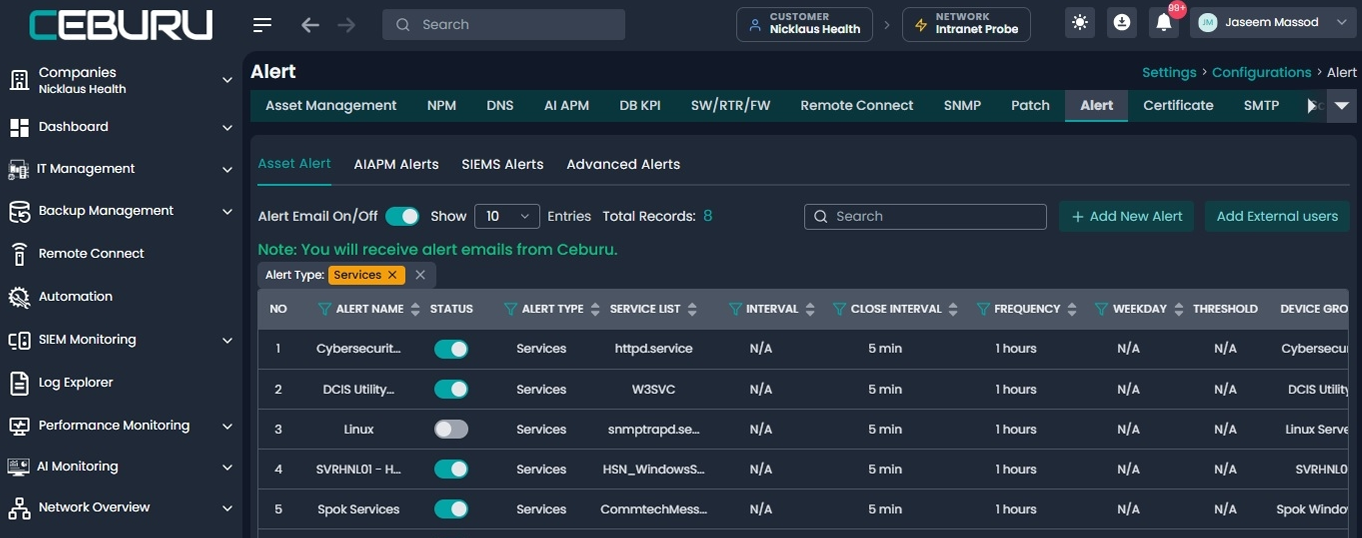
The Asset Alert page displays configured alerts with information including:
Alert Name and Status
Alert Type and Service List
Close Interval and Frequency
Device Group
Users can manage service alert configurations from this page.
2. Creating a Service Alert
To create a Service Alert:
Navigate to Settings > Configurations > Alert > Asset Alert.
Click Add New Alert.
Enter the Alert Name.
Select Services from the Alert Type dropdown.
Select the required service from the Service List.
Choose the applicable Device Group.
Configure the relevant notification settings.
Save the alert configuration.
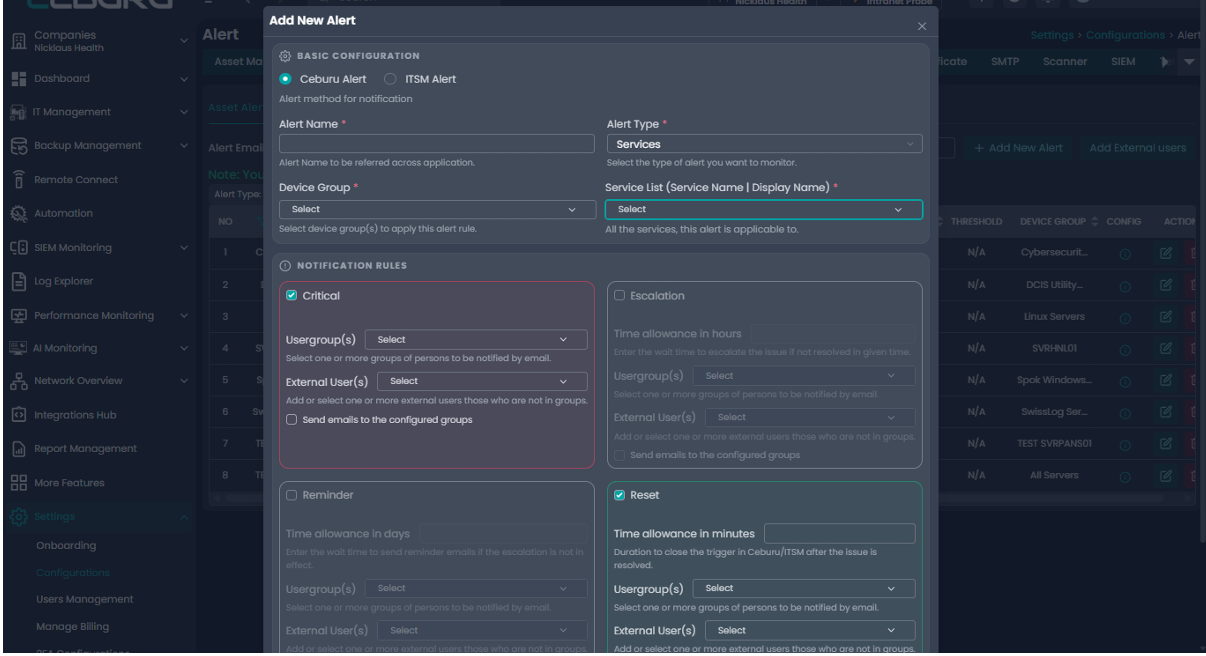
The alert configuration interface includes the following notification sections:
Setting | Description |
|---|---|
Critical | Configure critical alert notifications. |
Escalation | Configure escalation notifications. |
Reminder | Configure reminder notifications. |
Reset | Configure reset notifications. |
These settings can be configured according to the monitoring requirements.
3. Viewing Service Trigger History
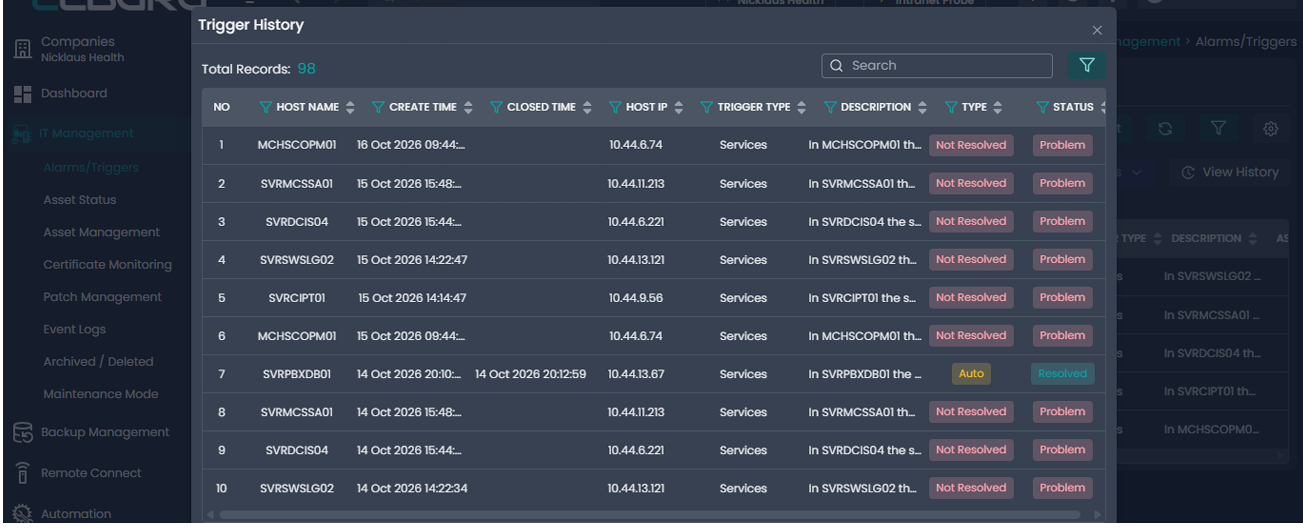
The Trigger History page allows users to view historical service triggers.
To access Trigger History:
Navigate to IT Management > Alarms/Triggers.
Click View History.
The Trigger History window displays previously generated triggers.
Locate records where Trigger Type = Services.
The Trigger History table includes information such as Host Name, Create Time, Closed Time, Host IP, Trigger Type, Description, Type, and Status.
4. Viewing Active Service Triggers
Service triggers generated by Asset Alert rules can be viewed from the Asset Alarms/Triggers page.
To view service triggers:
Navigate to IT Management > Alarms/Triggers > Asset.
Open the trigger filter options.
Select Services under Trigger Type.
Apply the filter to display service related triggers.
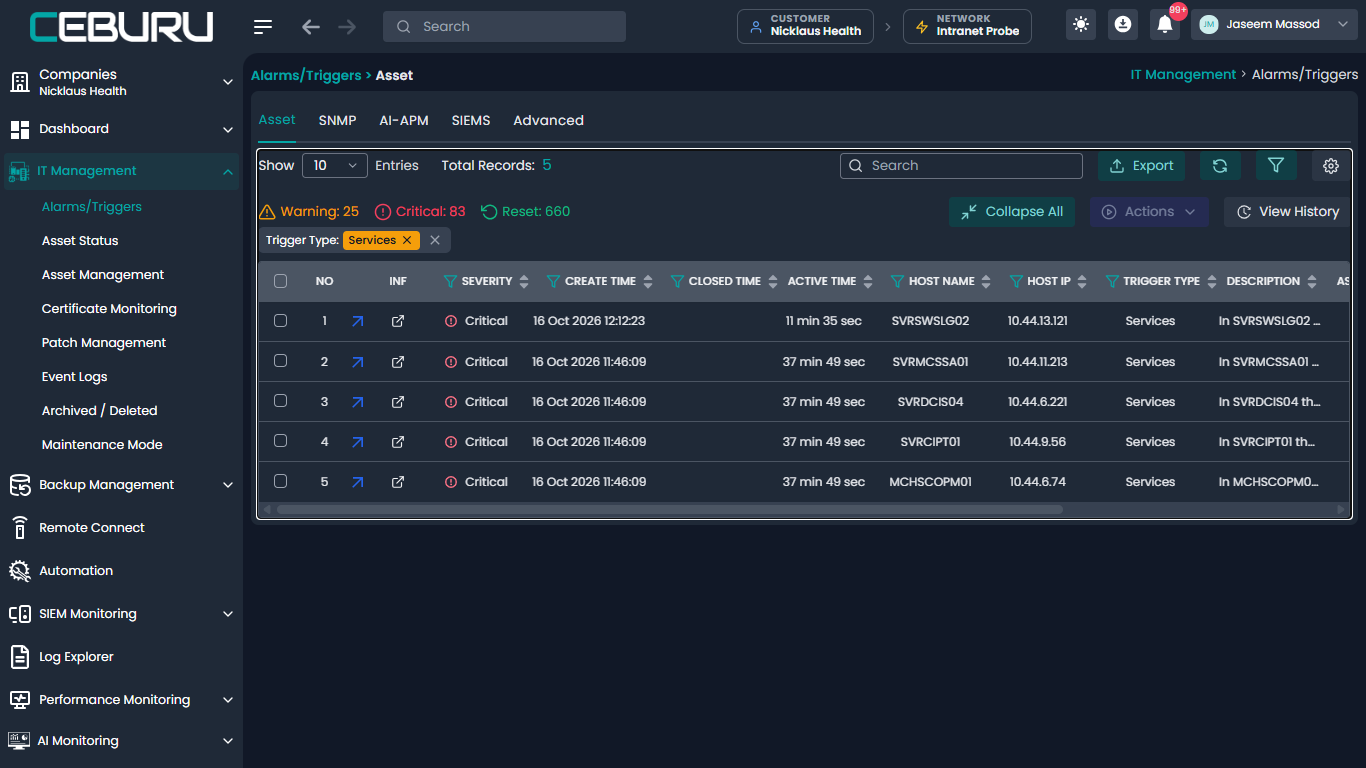
Users can filter the trigger records using the following fields:
Severity
Create Time
Active Time
Host Name
Host IP
The trigger table provides details about service related alerts, allowing users to review the affected hosts and associated trigger information.
5. Service Alert Navigation Reference
Action | Navigation |
|---|---|
View Service Alerts | Settings > Configurations > Alert > Asset Alert |
Create Service Alert | Asset Alert > Add New Alert > Services |
View Trigger History | IT Management > Alarms/Triggers > View History |
View Service Triggers | IT Management > Alarms/Triggers > Asset > Trigger Type: Services |
Was this article helpful?
That’s Great!
Thank you for your feedback
Sorry! We couldn't be helpful
Thank you for your feedback
Feedback sent
We appreciate your effort and will try to fix the article