Log Management - Log Forwarder and Collector Installation
Ceburu’s Log Management module supports a distributed architecture using Log Forwarders and Log Collectors for efficient log ingestion and routing.
Log Forwarder and Collector Installation Requirements:
The following prerequisites must be met to install and operate the Log Forwarder and Collector successfully.
Click the below link to see the System requirements:
CeburuAI Installation and Configuration
Make sure exclude all subdirectories within the following folders from the firewall:
C:\Program Files\CeburuAILogCollectorC:\Program Files\CeburuAILogForwarderC:\Program Files\CeburuAI
Architectural Diagram:

Forwarders handle log transport between agents and collectors, while collectors perform aggregation and normalization before sending logs to the analytics engine.
1. Access the Log Management Configuration
Navigate to Configurations → Log Management.
You will see two sections:
Log Forwarders Configuration
Log Collectors Configuration

2. Setup a Log Forwarder
Click the Setup Log Forwarder button (top-right corner).
In the setup window:
Select Device: Choose the device where the forwarder will be installed (for example, your Primary Probe).
Forwarder Port: Specify the port number (default is
24224).Note: The port cannot be changed after the forwarder is created.
Click Install Forwarder to begin deployment.

Once the installation is complete:
The forwarder will appear under Log Forwarder Configuration.
Its status will update to Installed and then Active once connected successfully.
Install multiple forwarders for redundancy or for different network zones.
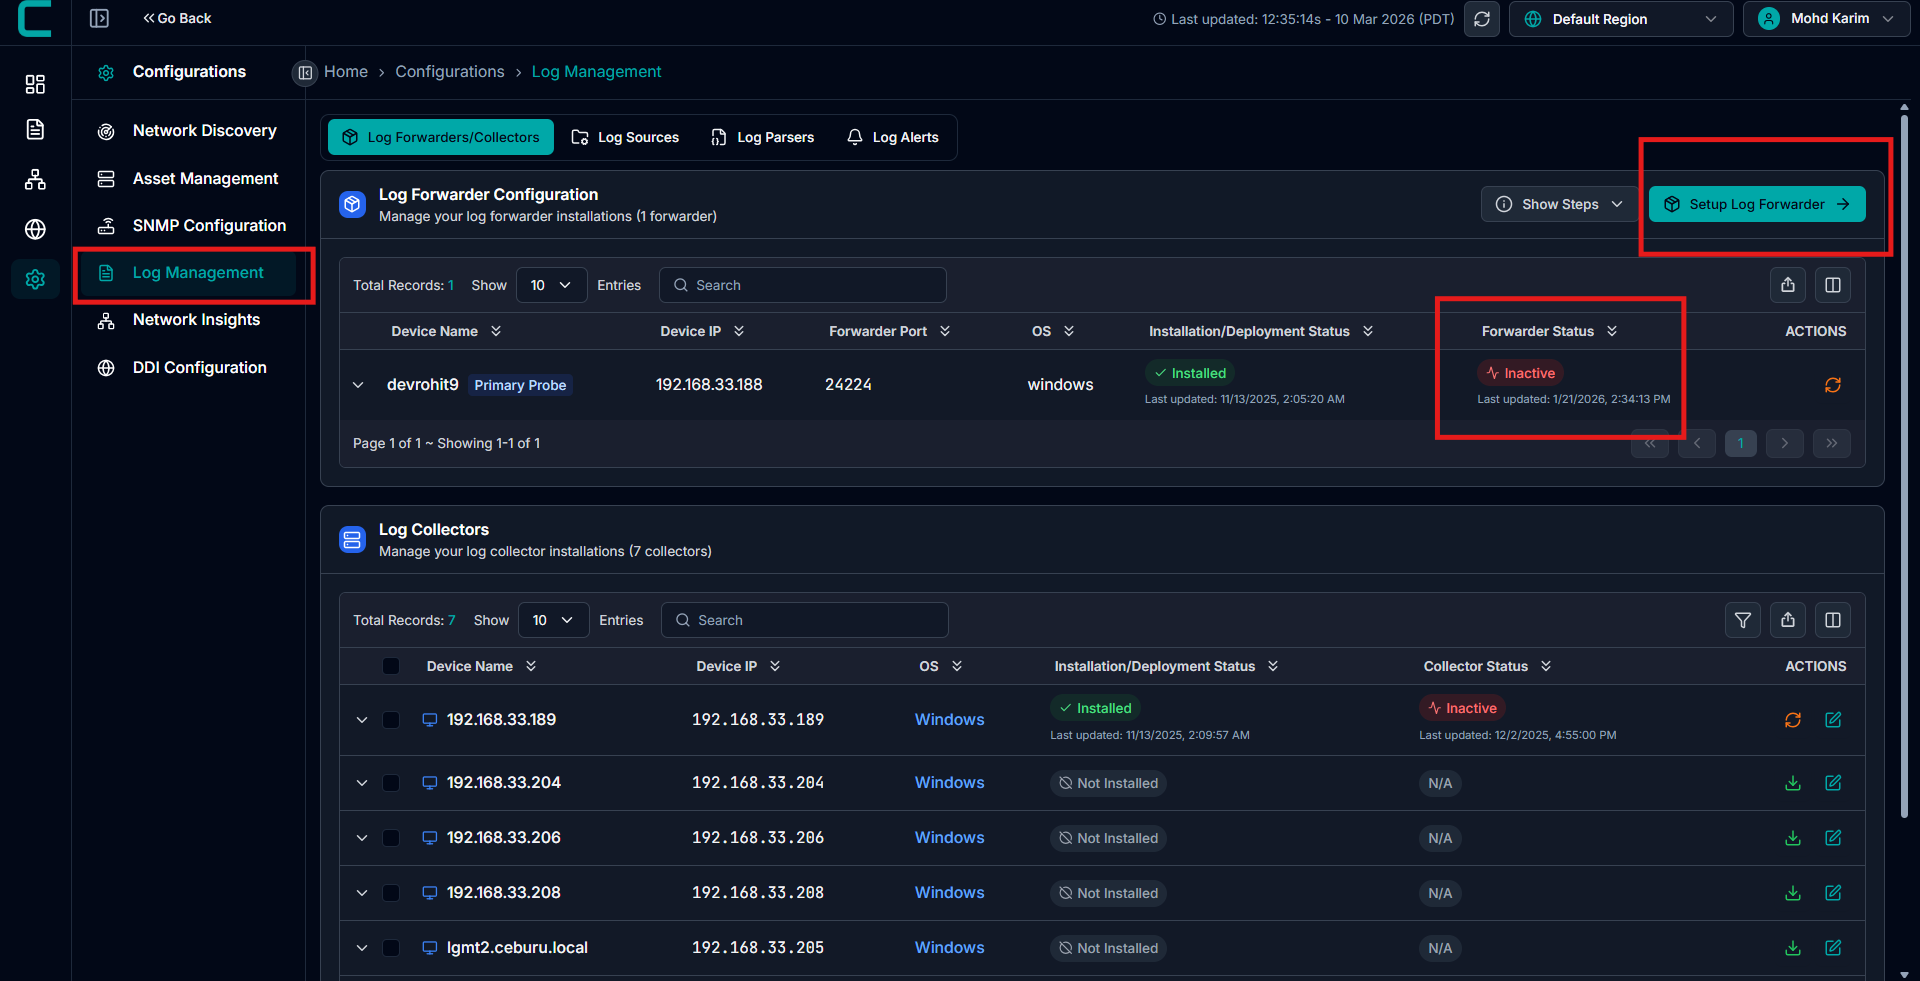
Install Log Collectors
After setting up the forwarders, you can deploy Log Collectors to capture and process logs.
There are two installation options:
Option A: Install Individually
Under the Log Collectors section, locate the device where you want to install the collector.
Click the Download icon next to the device entry.
The collector will automatically install and begin connecting to the assigned forwarder.
Option B: Bulk Installation
Select multiple devices in the Log Collectors section.
From the top-right dropdown menu, choose Deploy Collector.
The collectors will be installed on all selected systems simultaneously.
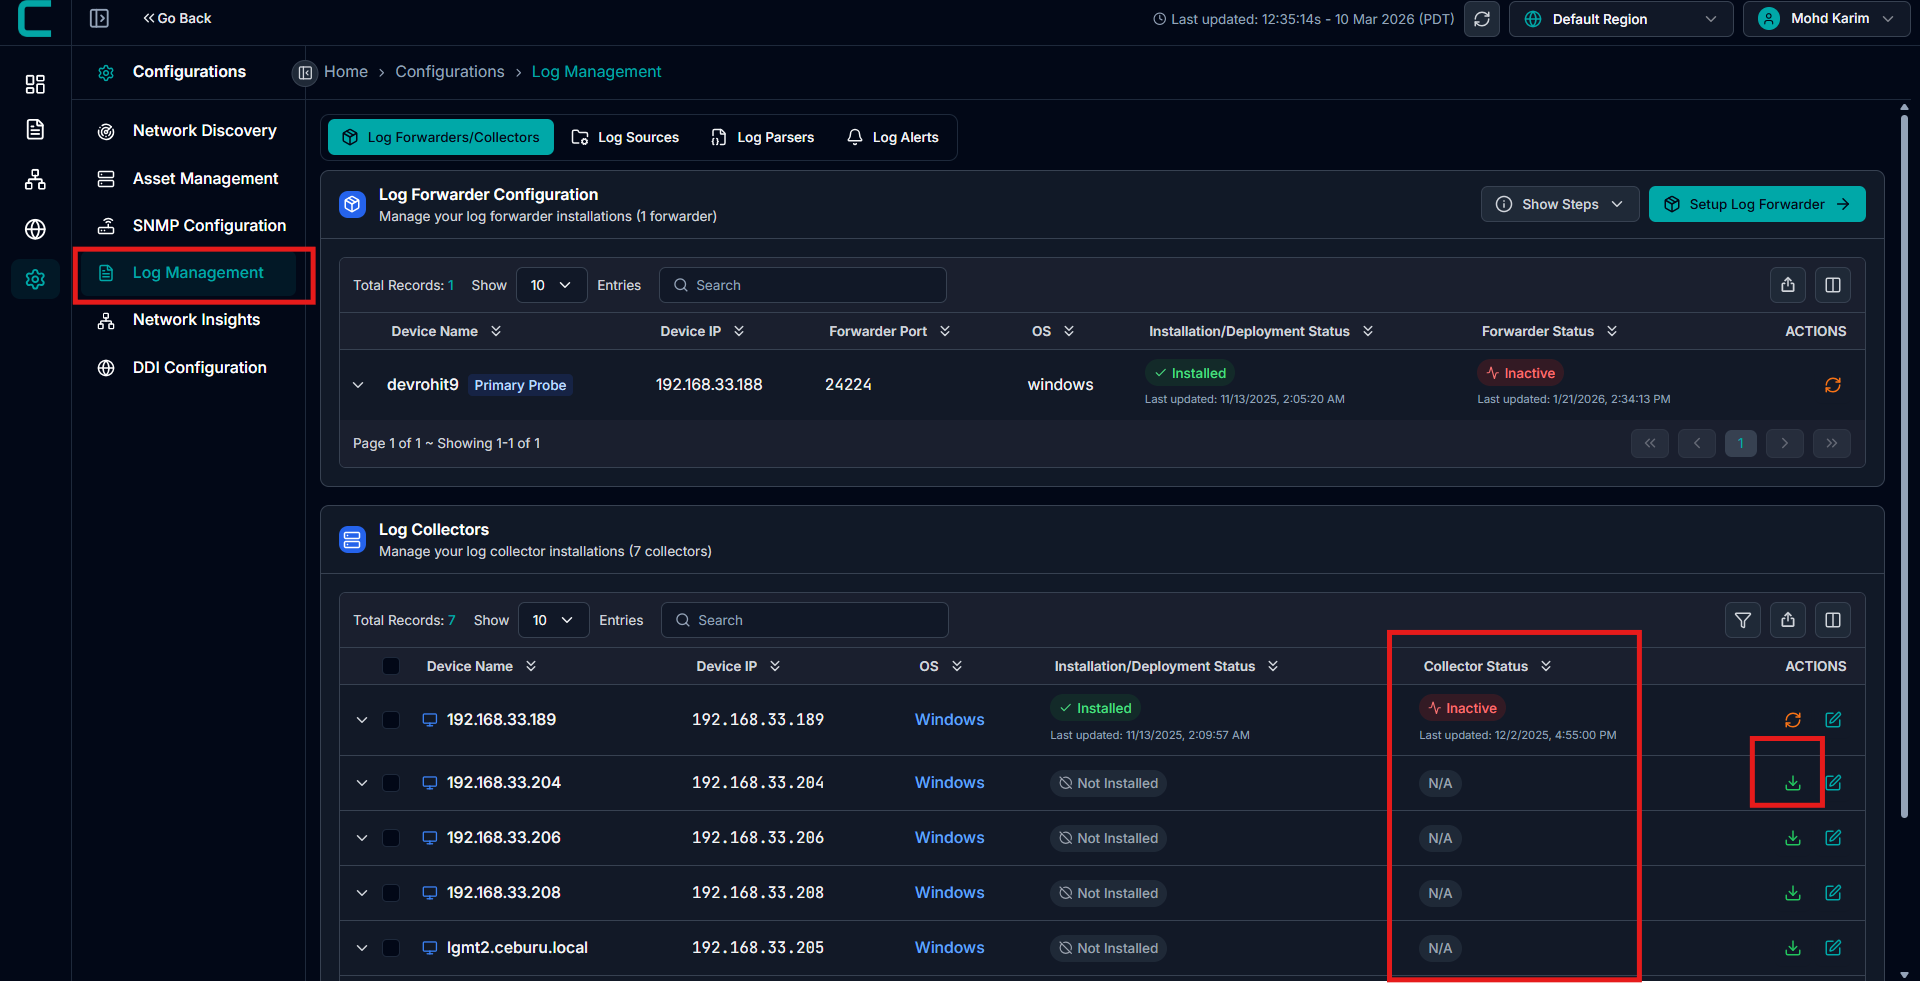
Verify Deployment:
Once installation is complete:
Forwarders will appear under Log Forwarder Configuration with a status of Active.
Collectors will appear under Log Collectors with the Collector Status showing Active.
If any collector or forwarder shows as Inactive or Failed, click the restart icon under the Actions column to retry or troubleshoot.
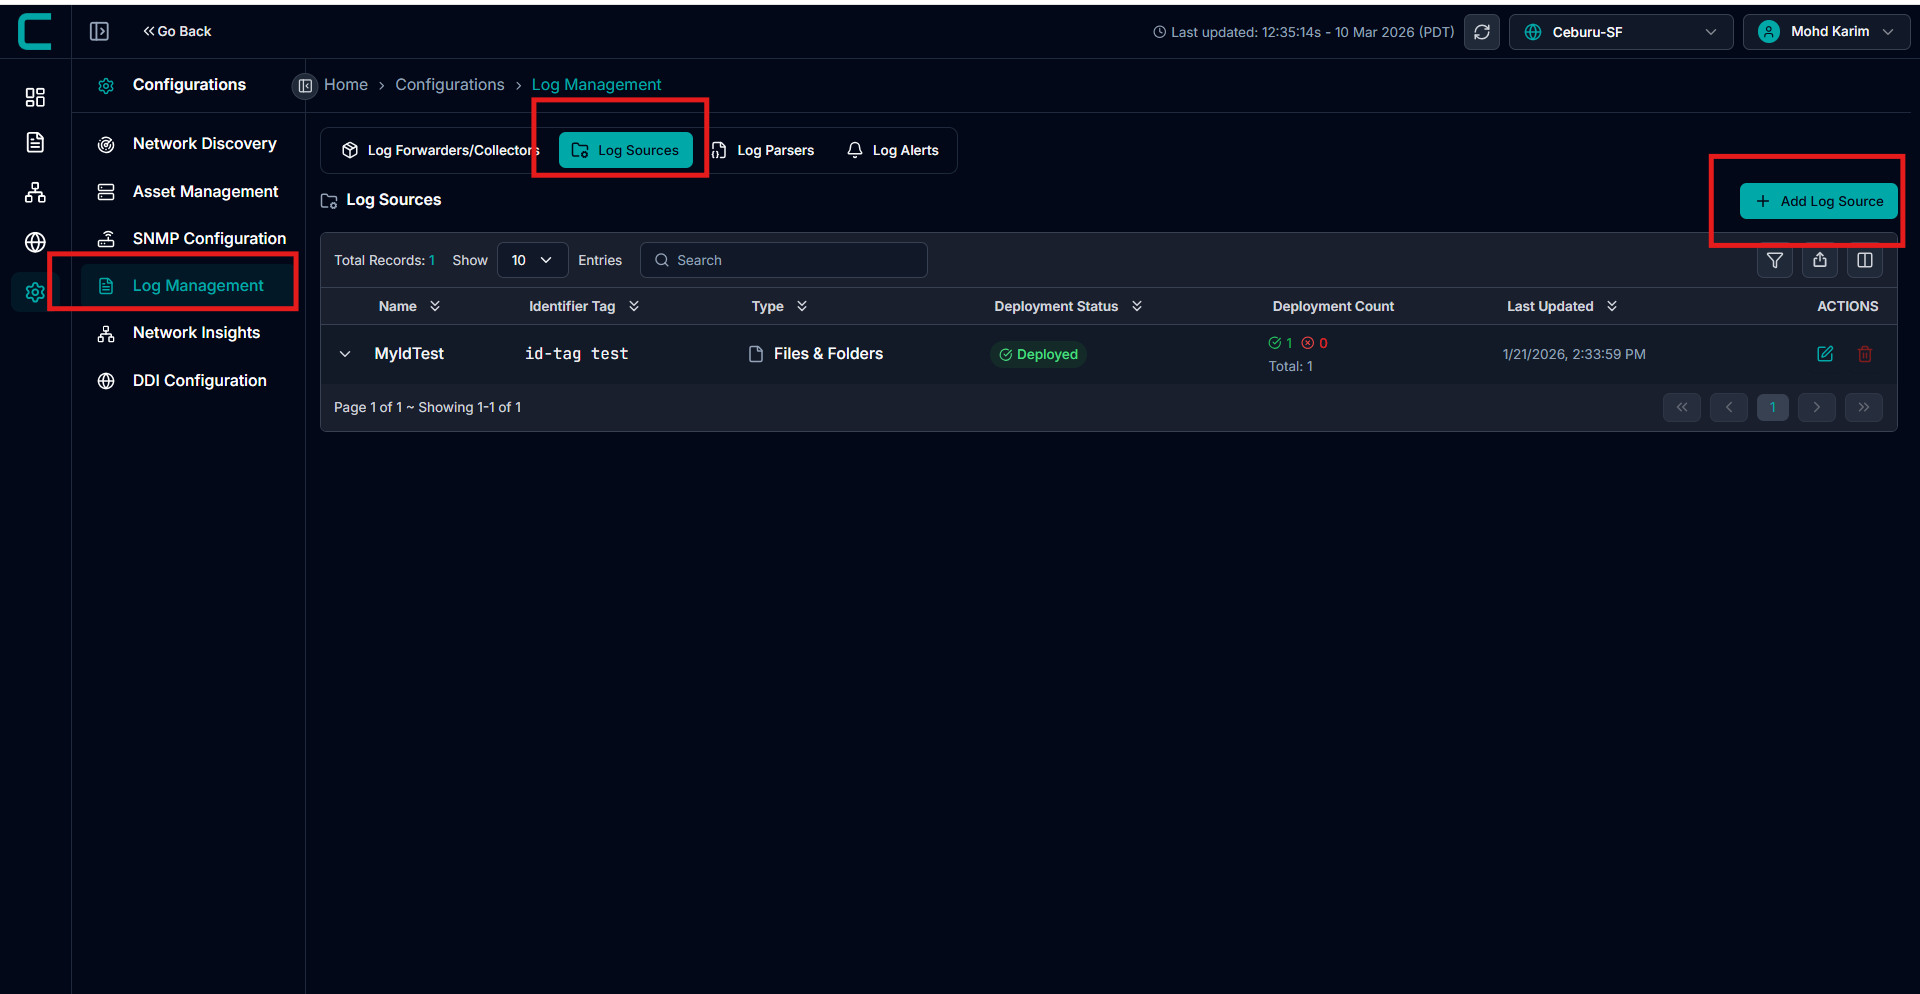
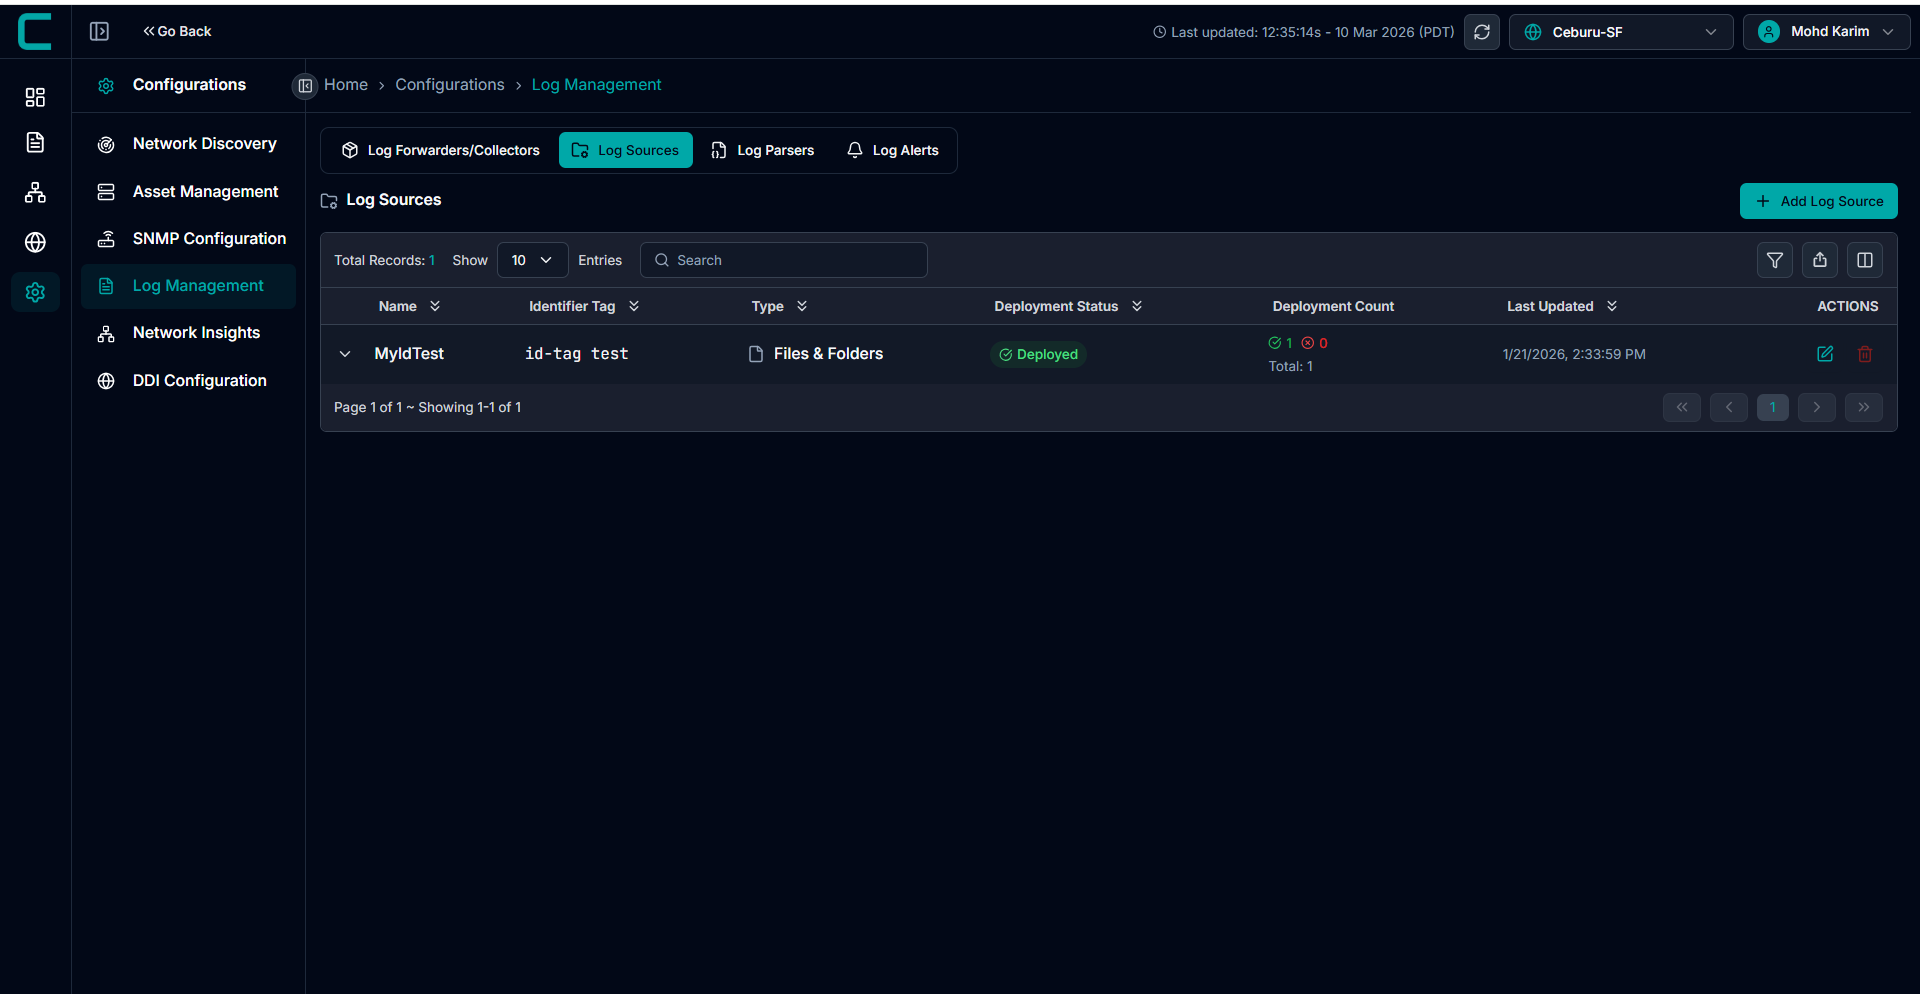
Configure Log Source:
Go to the Log Management tab. Click on Add Log Source in the Log Sources section.
Log sources define where logs are collected from and how they are ingested into the system. Each log source configuration specifies the source type, collection parameters, and the target machines where the log collector is deployed.
Enter Log Source Details
Identifier Tag
The identifier tag is used to index and query logs across the log management system.
Rules:
No spaces allowed
Allowed characters include uppercase and lowercase letters, numbers, and special characters
- _ ~ ! @ # $ & * + ; : , . ? < > \ | /
Usage:
Used for filtering, searching, and identifying log data across the platform
Examples:
production-webapp
staging_api
tag1-23
Production@2024
API_Service#1
Querying Tags
Querying tags are key value pairs attached to all logs collected from a source. They help filter and search logs across services and machines.
Format:
Stored as JSON key value pairs
Example:"environment": "prod"
Character Rules:
Only lowercase letters, numbers, hyphens, and underscores are allowed
Multiple Tags:
Multiple tags can be added to categorize logs
Editing and Deletion:
Tags cannot be edited after creation
To change a tag, delete and re add it
Deleting a tag only affects future logs, not existing data
Examples:
"environment": "production""service": "webapp""category": "application"

Specify Log File Configuration
Files and Folders:
Used to collect logs directly from files on a system.
Key Settings:
File Path: Absolute path to the log file
Example:/var/log/application.logFile Pattern: Wildcards to match multiple files
Example:/var/log/*.logEncoding: File encoding format, default UTF 8
Parser: Select based on log format
Multiline Pattern: Optional regex for multiline logs
Advanced Parameters: Tune performance and memory usage

Syslog:
Used to receive logs over the network from servers and network devices.
Key Settings:
Mode: UDP or TCP transport protocol
Port: Listening port for syslog messages
Default commonly used port is 514Parser: RFC 5424 for modern syslog or RFC 3164 for legacy formats
Advanced Parameters: Optimize handling of high volume log streams

HTTP Events:
Used when applications push logs using HTTP POST requests.
Key Settings:
Listen Address: Fixed to
0.0.0.0to accept requests from all interfacesPort: Port for receiving HTTP log events
Parser: JSON parser for structured payloads
Advanced Parameters: Configure buffer sizes and response handling
Successful Response Code: Default is 201

Windows Event Logs:
Windows Event Logs supports two collection modes:
- Local Mode
Collect logs from the same machine where the collector is installed - Remote Mode
Collect logs from remote machines using credentials, without installing a collector on each target
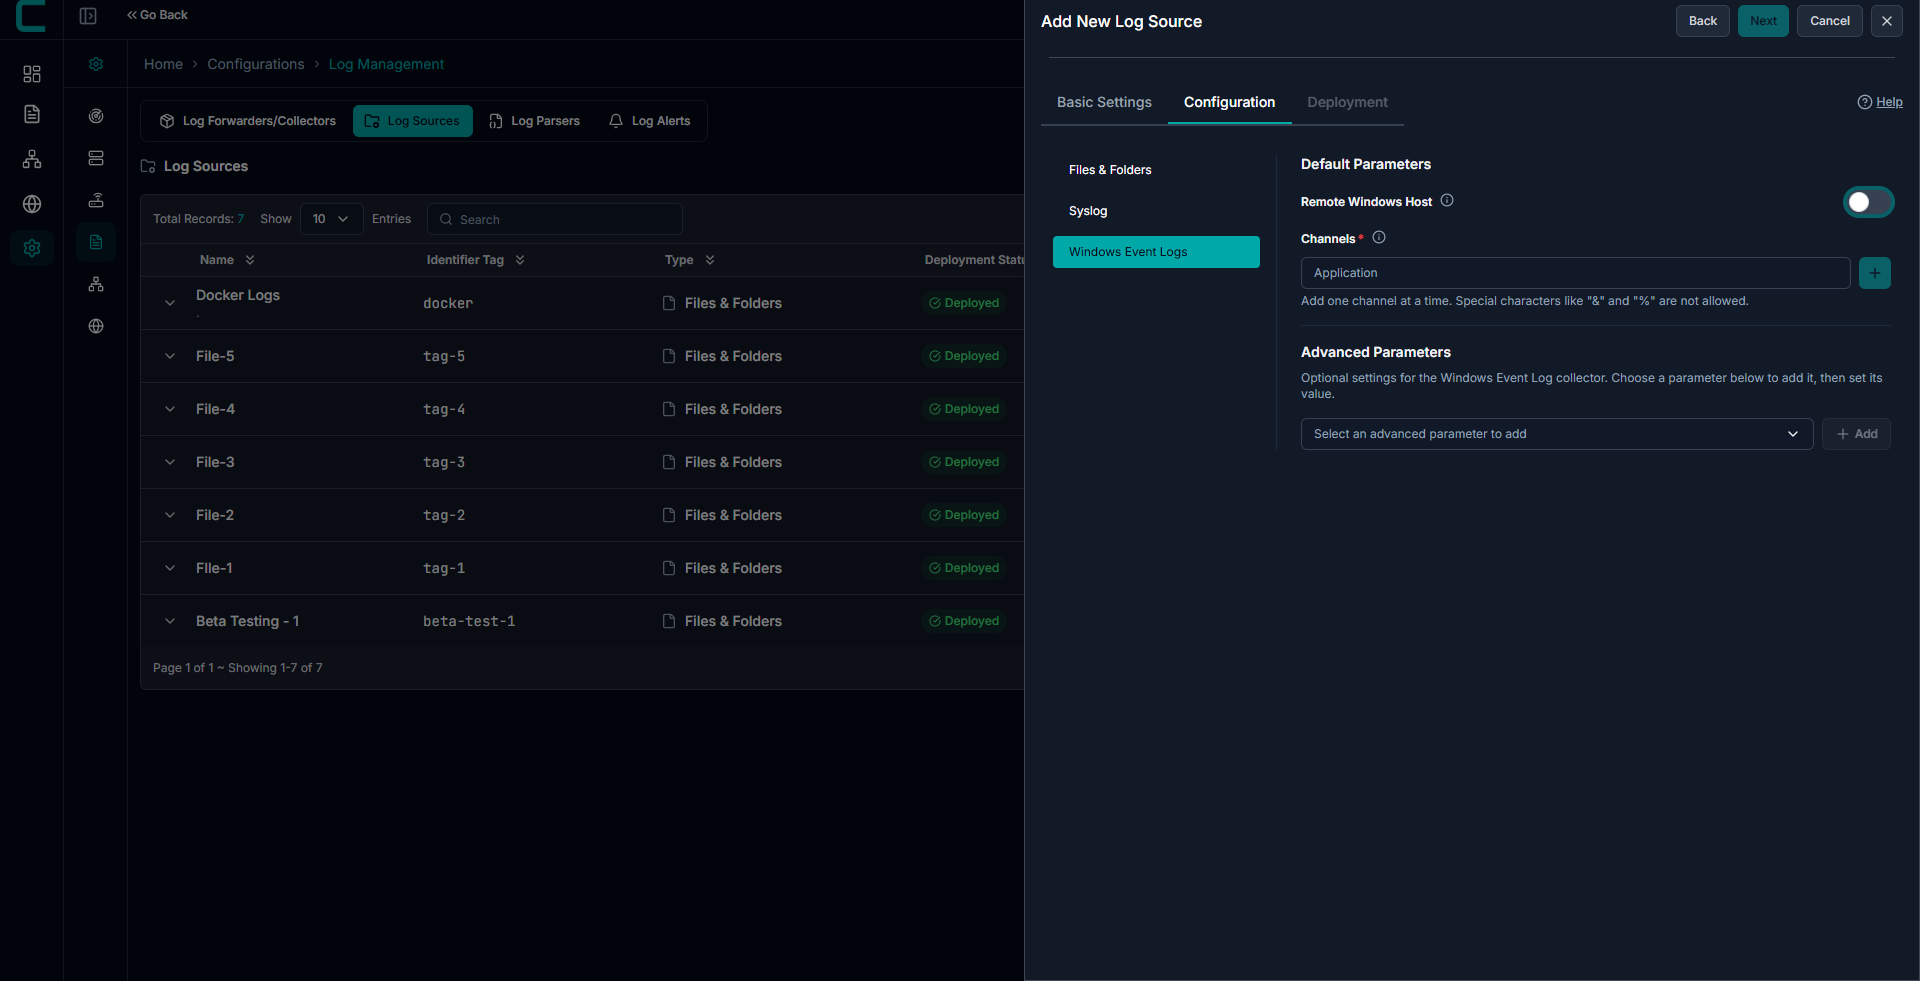
Local Mode Configuration:
Use Local Mode when the collector is installed on the same system where logs are generated.
Channels:
- Enter valid Windows Event Viewer log names
- Common examples:
- Application
- System
- Security
Important Notes
- Channel names must match exactly as shown in Event Viewer
- Incorrect or misspelled names will result in no data collection
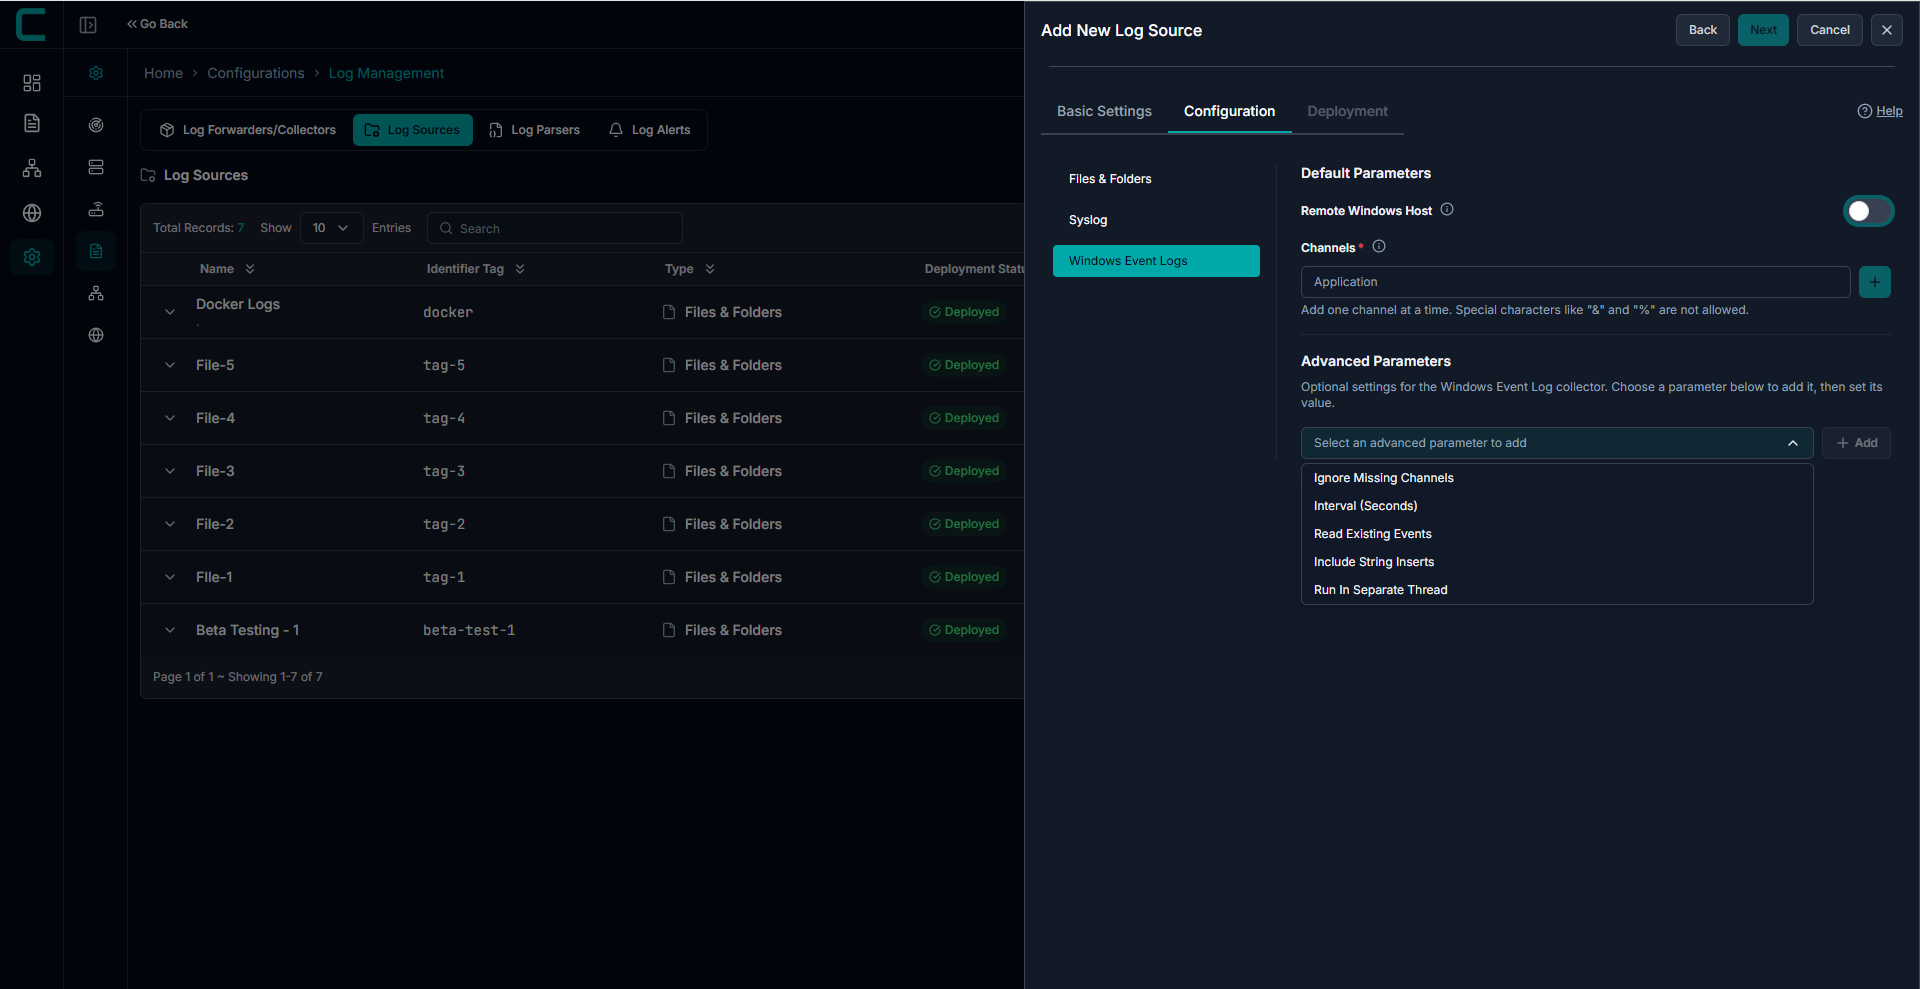
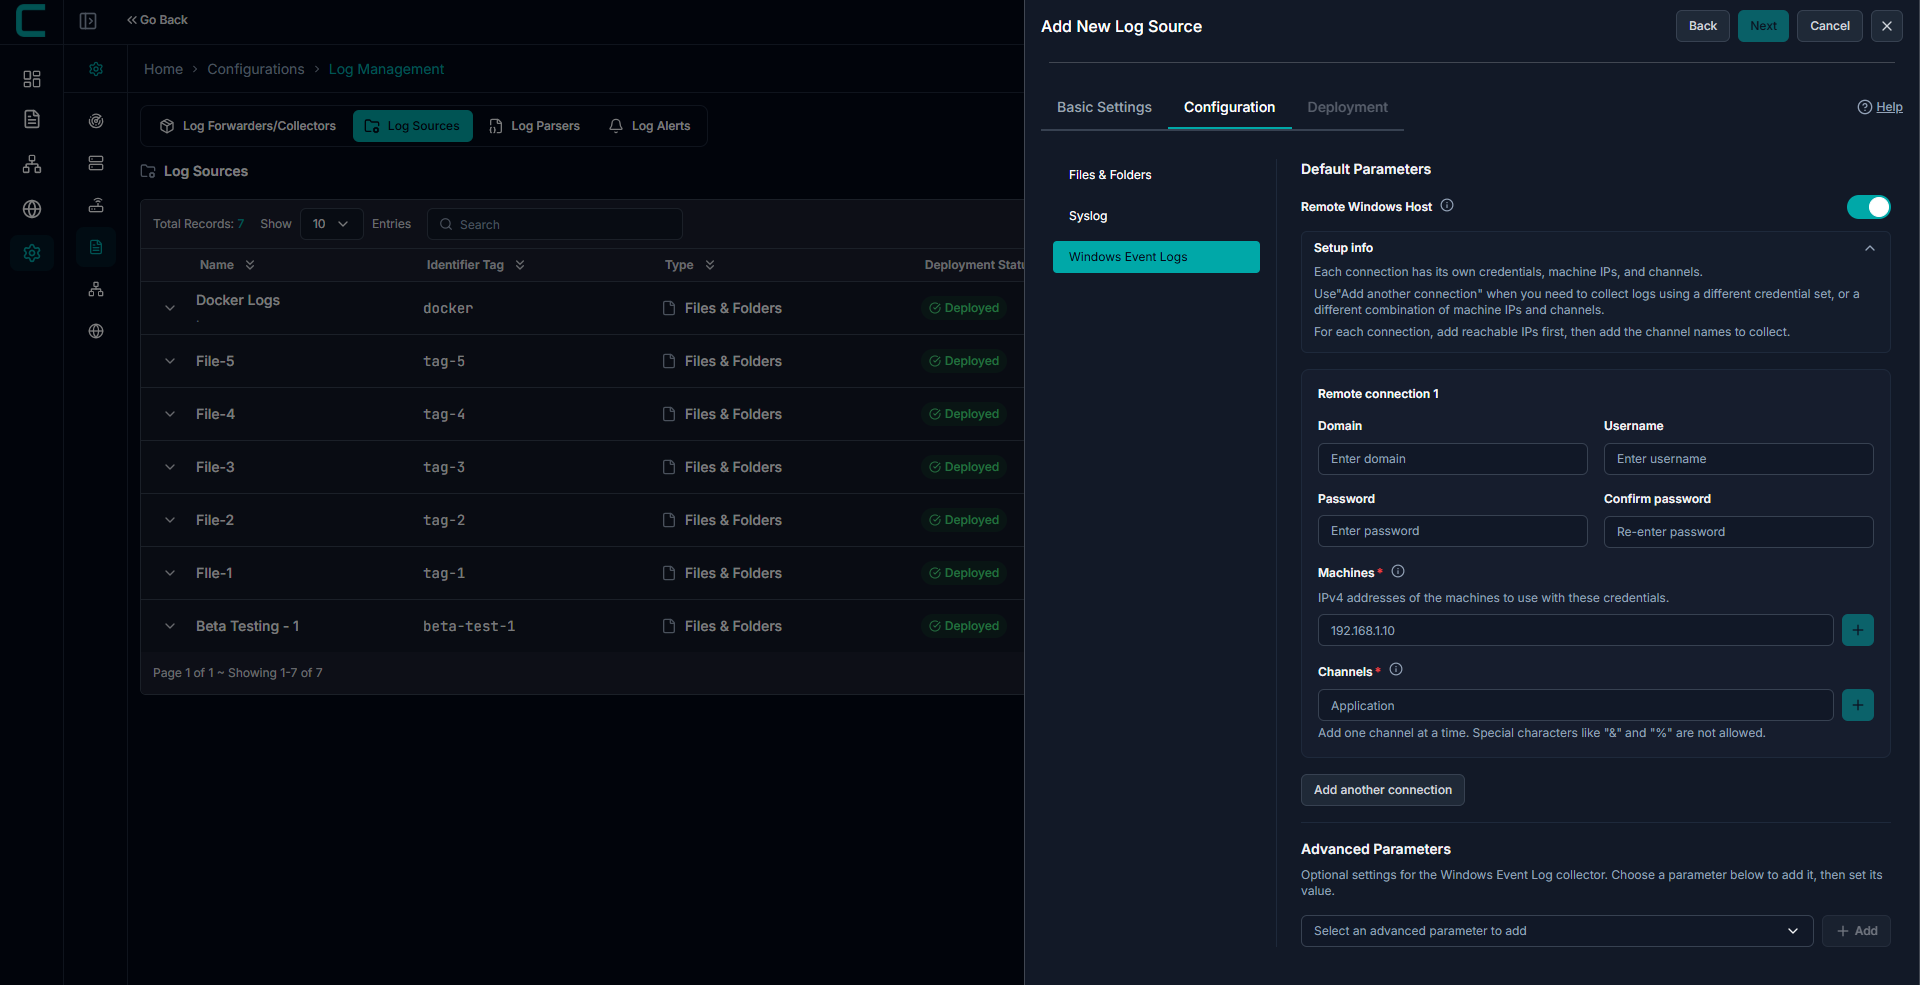
Remote Mode Configuration:
Enable Remote Windows Host to configure remote log collection.
Machines
- Enter IPv4 addresses of target machines
- Multiple machines can be added
Channels
- Provide valid Windows Event log channel names
- Same rules as Local Mode apply
Credentials
- Domain (if applicable)
- Username
- Password
Authentication will fail if credentials are incorrect
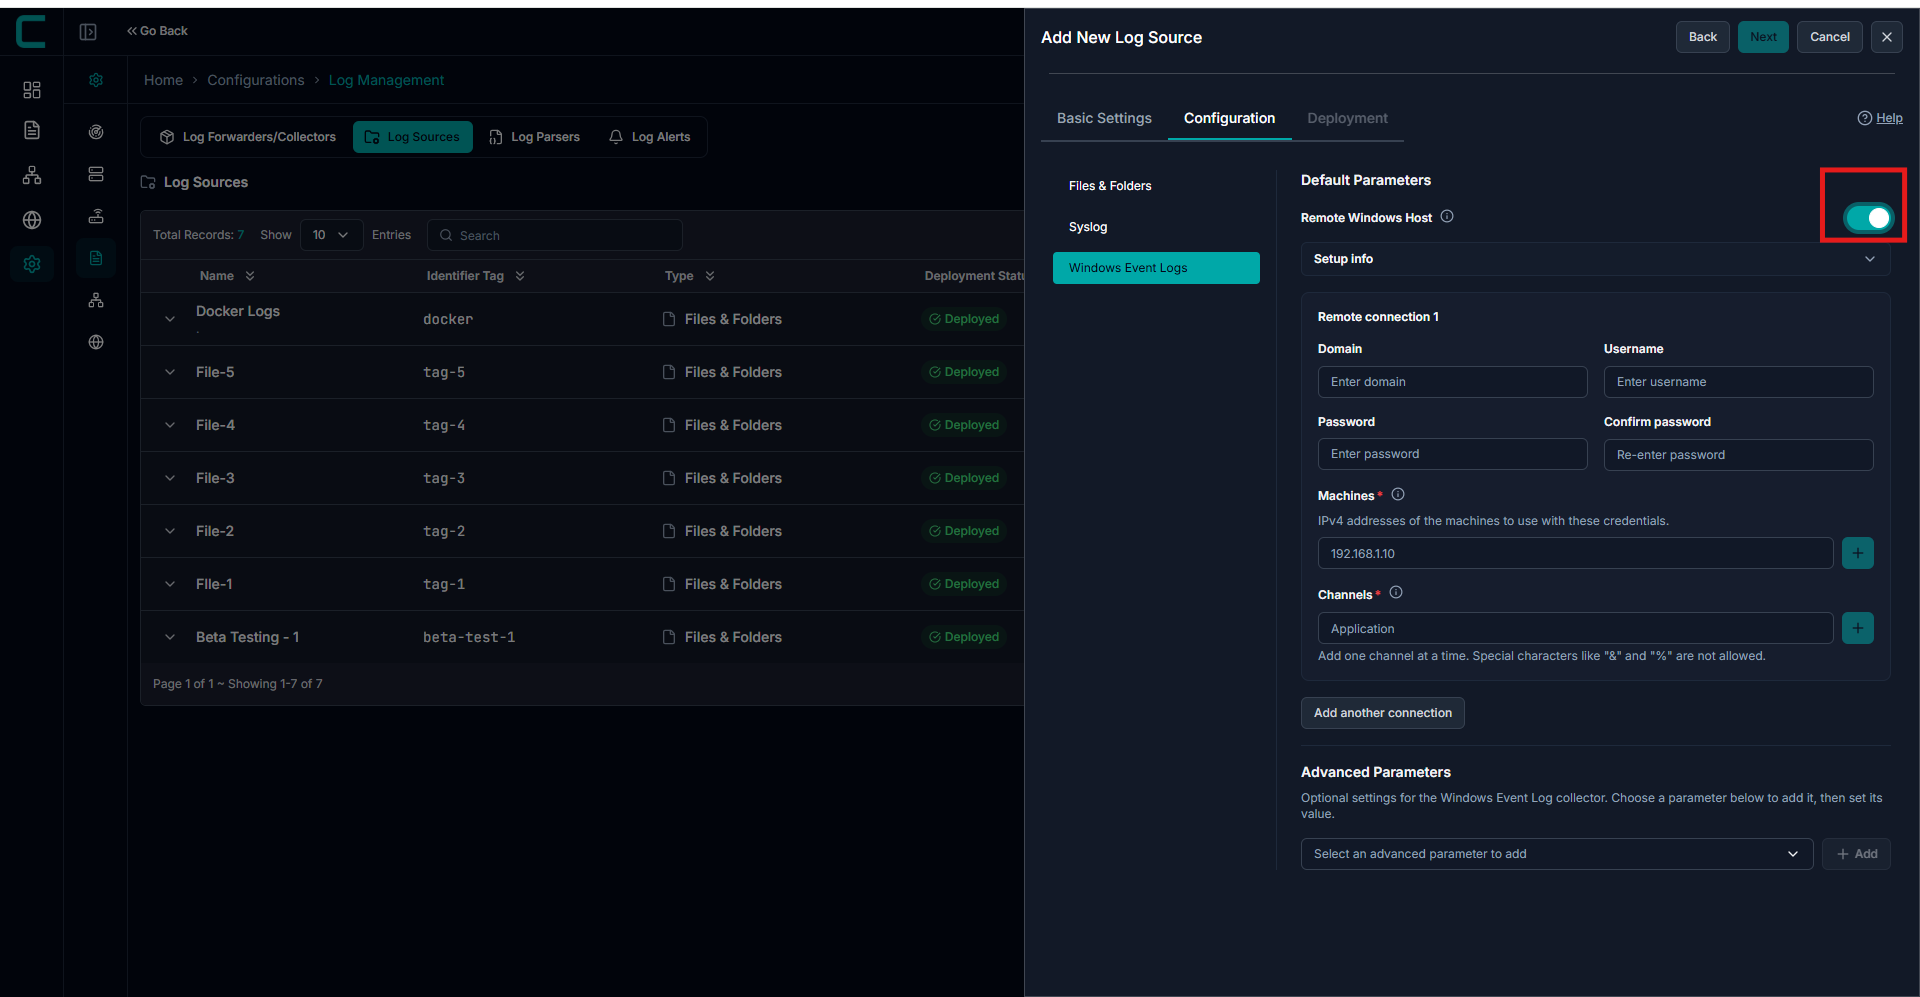
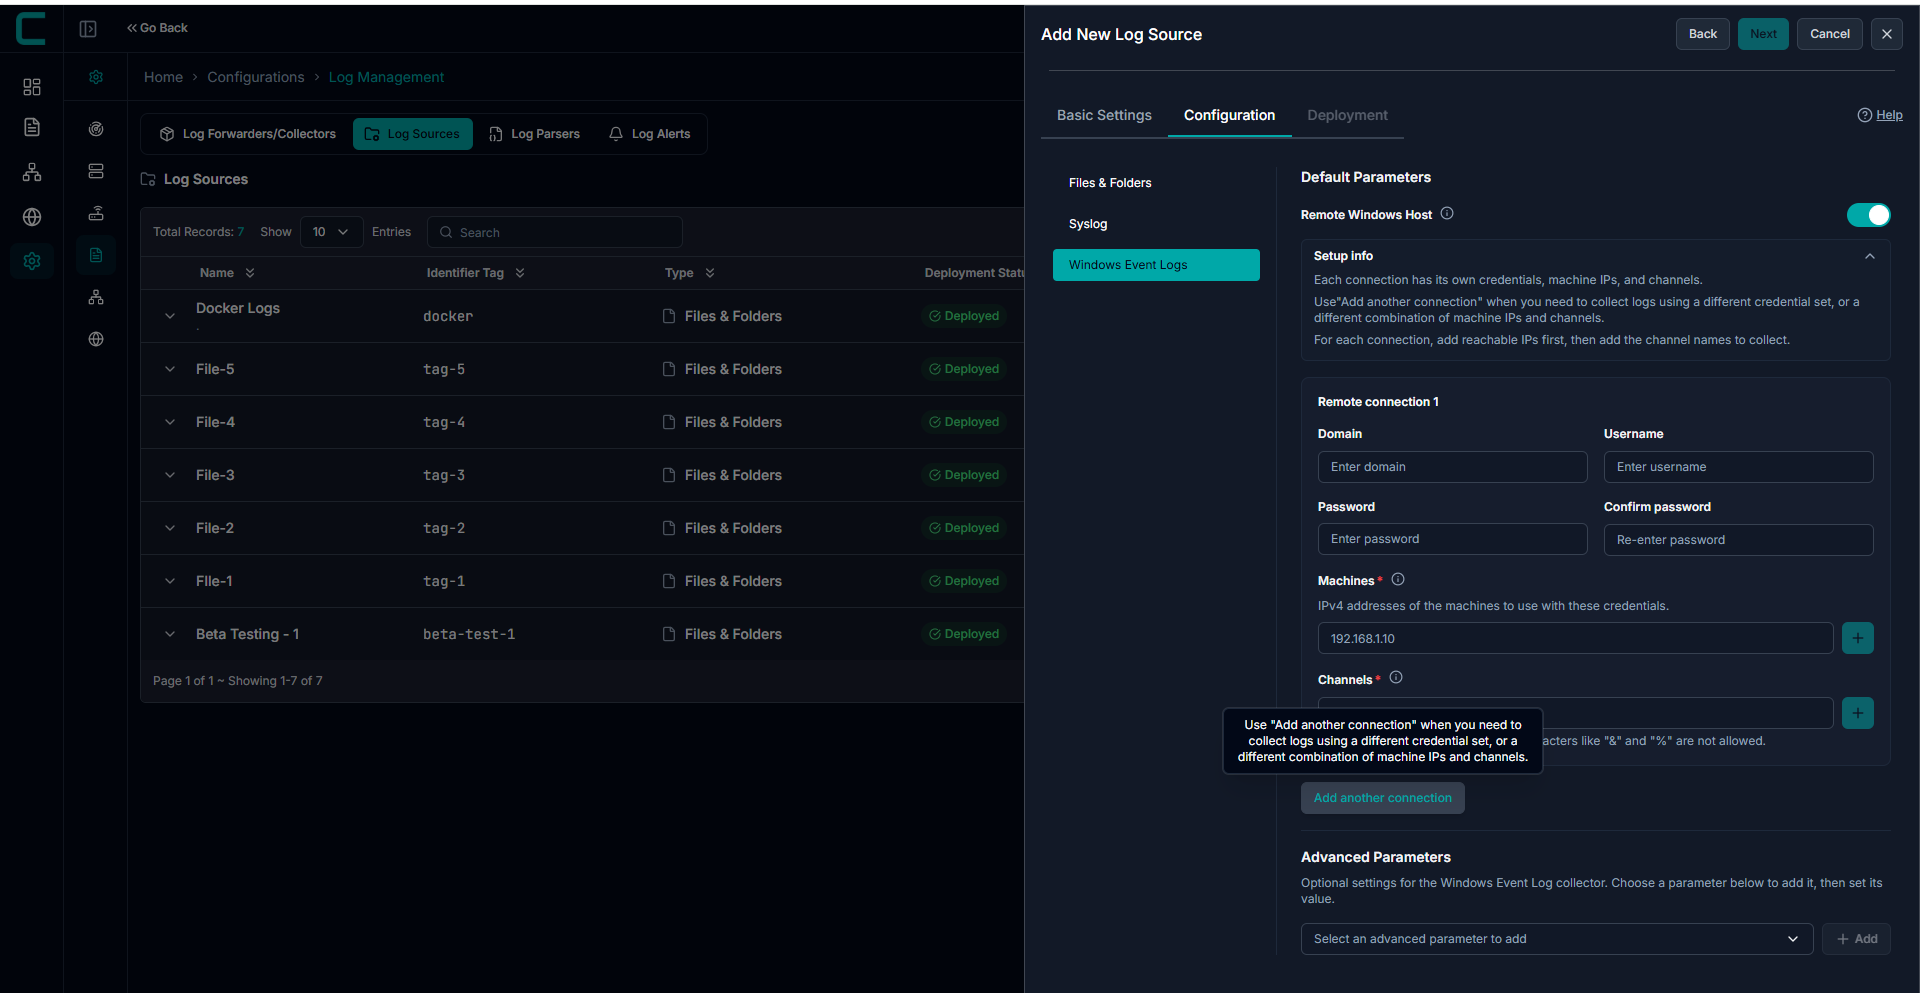
Multiple Connections
Use Add another connection when:
- Different credentials are required
- Different machine groups are used
- Different channel combinations are needed
Each connection block is independent
Permissions and Requirements (Remote Mode)
To successfully collect logs remotely, ensure the following:
1. User Permissions
- Account must be part of:
- Event Log Readers group
2. Security Log Access
- For Security logs:
- Requires Administrator privileges
- Or Manage auditing and security log permission
3. Firewall Configuration
Enable:
- Remote Event Log Management rule
4. Network Requirements
Ensure the following ports are open:
- Port 445 (SMB)
- RPC Dynamic Ports
Advanced Parameters
Advanced configuration options are available to optimize performance.
- Ignore Missing Channels
- Interval (Seconds)
- Read Existing Events
- Include String Inserts
- Run in Separate Thread
Use advanced settings for:
- High-volume log environments
- Performance tuning
- Memory optimization
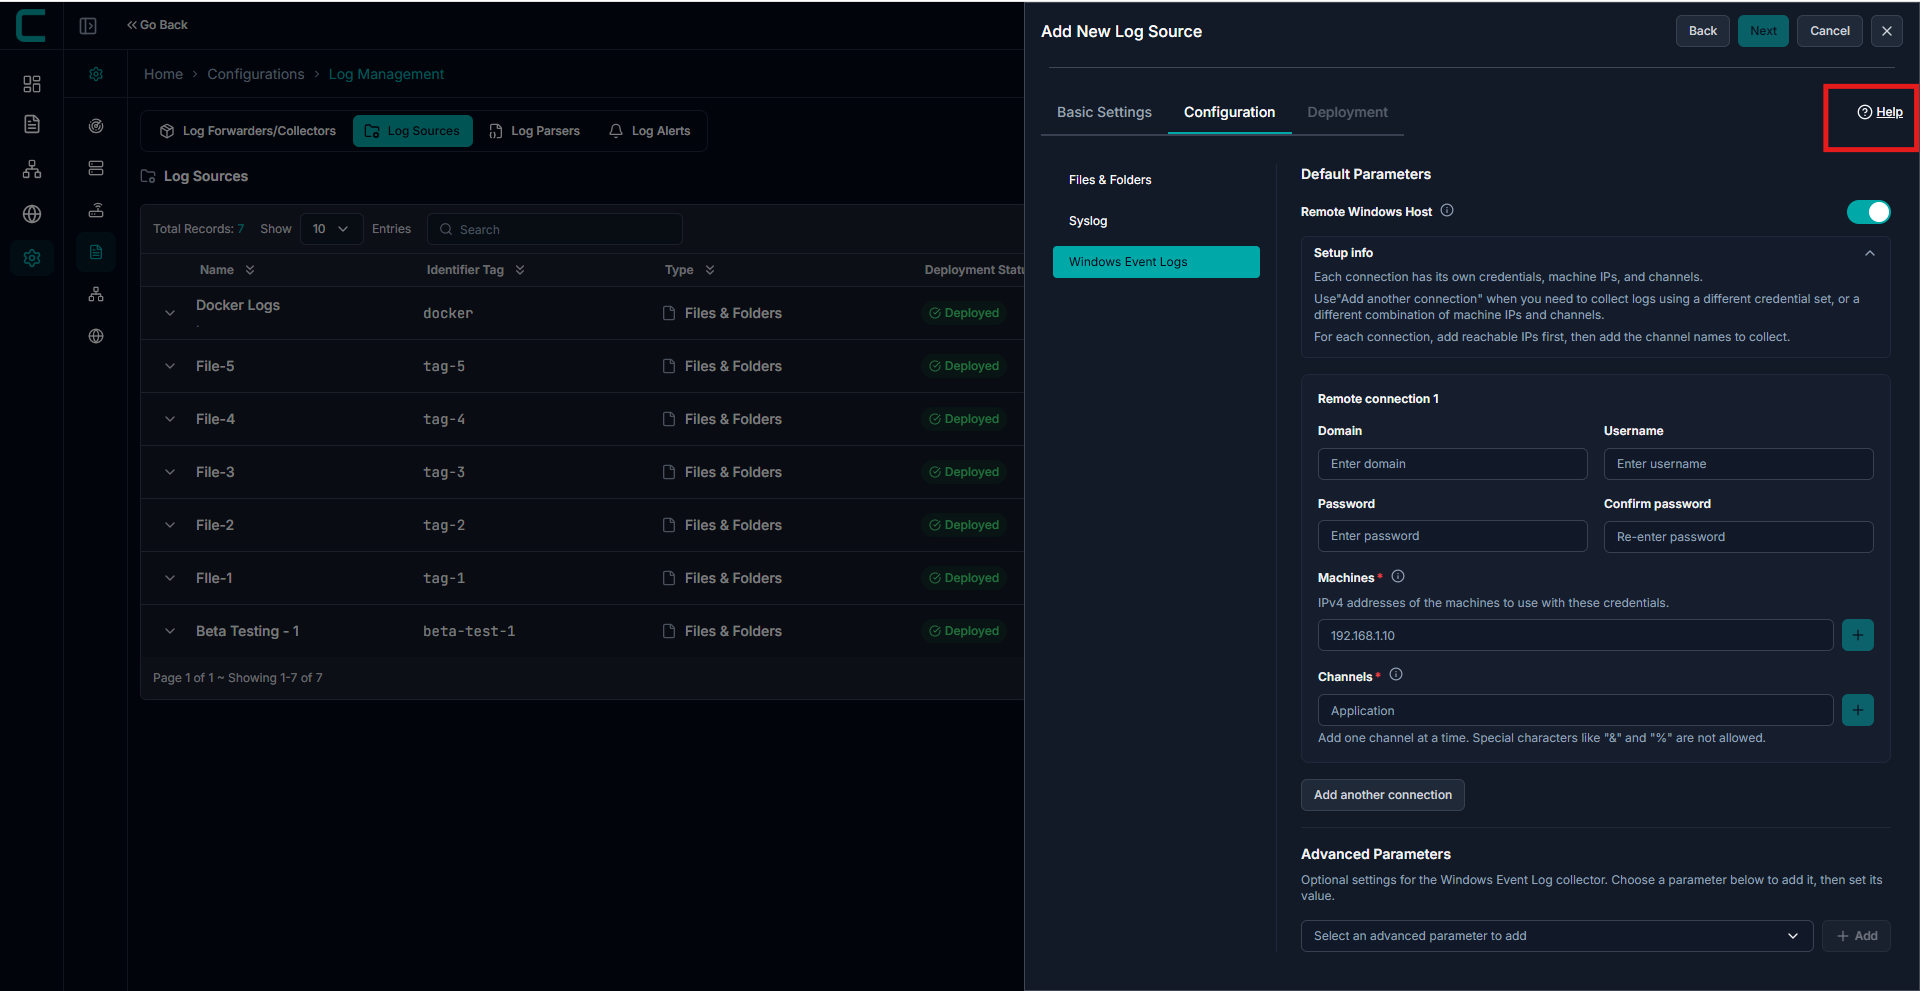
Click the Help option in the configuration screen to view these guidelines directly within the UI.
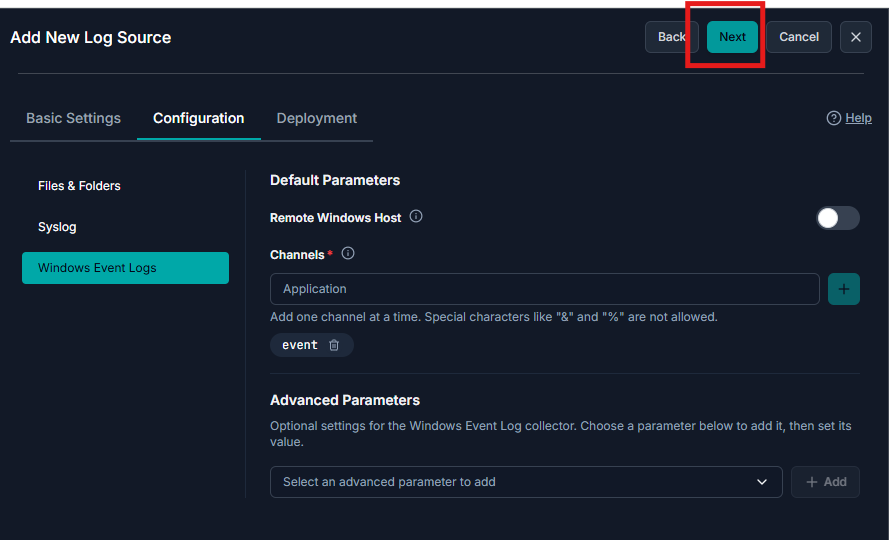
After entering all required details, click Next to proceed to the Deployment page.
Deployment:
Select the machines where the log collector will be installed.
Multiple machines can be selected
Deployment status is tracked per machine
Failed deployments can be retried

Once added, the new log source will appear in the Log Sources list for monitoring and analysis.
Make sure the file path and permissions are correct on the target device to avoid collection errors.
Was this article helpful?
That’s Great!
Thank you for your feedback
Sorry! We couldn't be helpful
Thank you for your feedback
Feedback sent
We appreciate your effort and will try to fix the article